An illustrative guide on how to create decarbonization pathways using emissions factors
Building a decarbonization pathway can be a daunting prospect, and ultimately all companies will have to face that challenge. Our aim to simplify that process, empowering businesses to be succesful while delivering on their sustainability goals.
The page below walks through the steps to build a decarbonization pathway - hopefully it provides some inspiration.
This page highlights the building of a decarbonization pathway for a notational integrated manufacturing company using the public emissions factor data shown inlink add here The steps below highlight the typical sequence to go through to build a decarbonization pathway. It shows our solution and how using optimisation can significantly simplify and reduce the cost to the business of delivering on your decarbonization goals.
Example companies motivation
Pressure from investors, supply chain, government and customers. The business wants to deliver a more valuable, more scalable, lower emissions set of solutions and remove its current risks associated with its high emissions status.
Challenge: Many of our key activities are associated with significant emissions
Todays key high emissions activities:
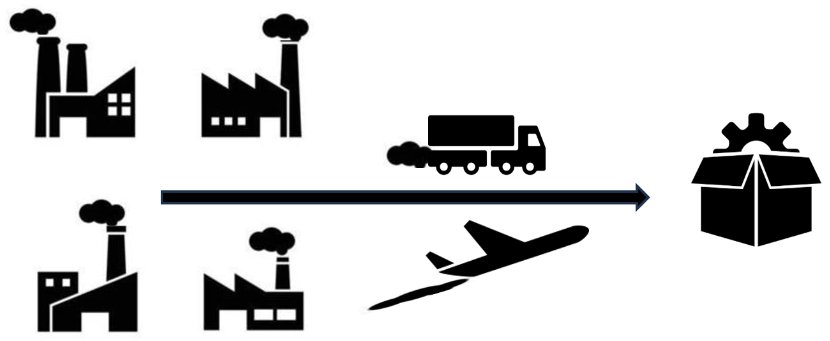
- Our current suppliers, processes and operations are all high emissions
- Our products have high embedded emissions
- Our business is getting pressure to change from investors and customers
- We risk having less appeal or even having stranded products and assets
- At some point our business will be forced to change or miss-out on future growth opportunities. Its better we plan the transition strategically
Future desired state:
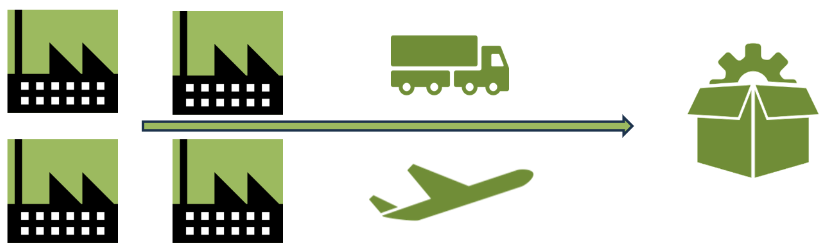
- Our future suppliers, processes and operations are low emissions
- Our products have low embedded emissions
- Our customers say they prefer our new solutions
- We have opened up new value streams and removed major risks from our business
- We have done that to maximize our businesses opportunities while minimizing the cost
Step 1: Defining the main emissions activities involved in producing the product
Below are the key high emissions activities for this business.
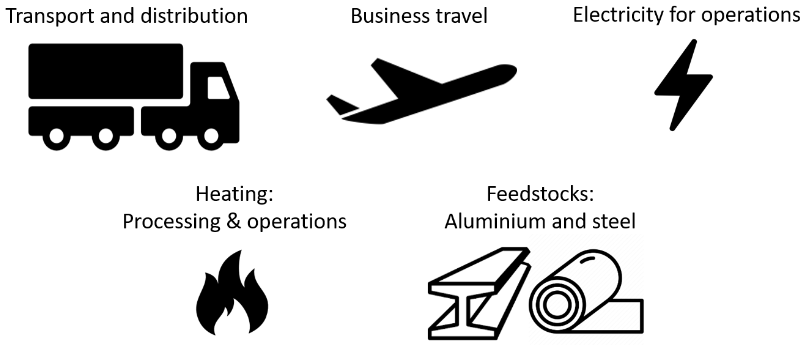
Step 2: Estimate the amount of activity required for those high emissions activities
The example company consumes:
- Transport: equivalent of 5 HGV’s
- Business travel: 150 international flights
- Heating: 2,500MWh
- Feedstocks: 1000 tonnes of aluminium and steel
- Electricity: 250MWh
For most businesses these numbers can usually be found from your spend database
The emissions factors for these products have been estimated using the public emissions factors shown on this page: link add here
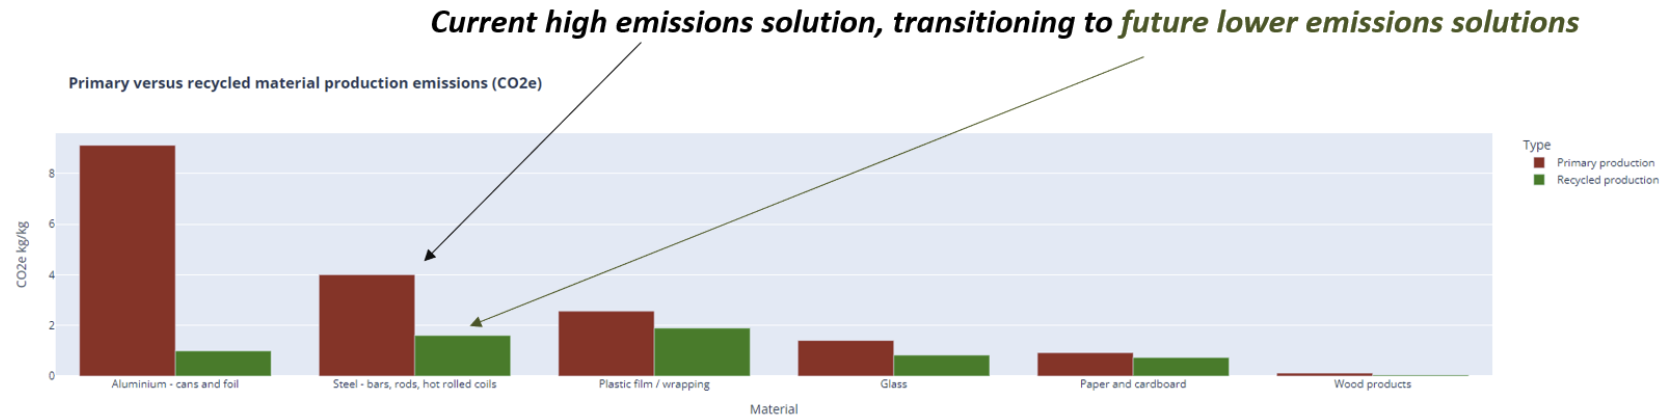
Step 3: Identify current (higher emissions) items and lower emissions alternatives (and rough costs)
- Start simple
- Note that at the earliest stages you probably won't know the absolute emissions of future options or the likely future price. You can model ‘what-if’ scenarios to understand which items will become influential for your business.
- Detail later
- When you know certain items are most impactful then you can investigate further with potential suppliers to refine your pathway.
- Focus on impactful things
- As always with pathway planning – it's important to focus on the big picture (the materially impactful items) and not get too focussed on the specifics. That can come later when its needed.
- Emissions numbers and costs
- Early analyses will typically use ball-park numbers for both emissions and costs. For emissions then the public or commercial emissions factor databases can provide good initial estimateslink add here. For costs then you can probably find out your current spend – you can approximate new costs to swap to lower emission alternatives. There is normally useful data on that that can be gleaned from the web (quick and good for first pass) and suppliers (more time consuming – useful for more mature analysis).
- Example emissions numbers and costs
- The following highlight the emissions numbers used for the notional company in this example. Costs were estimated from current prices as indicated on the web (e.g. London Metal Exchange). Emissions were estimated using the public emissions databases mentioned.
The companies current and future activity / consumption choices:
Steel choices
Aluminium choices
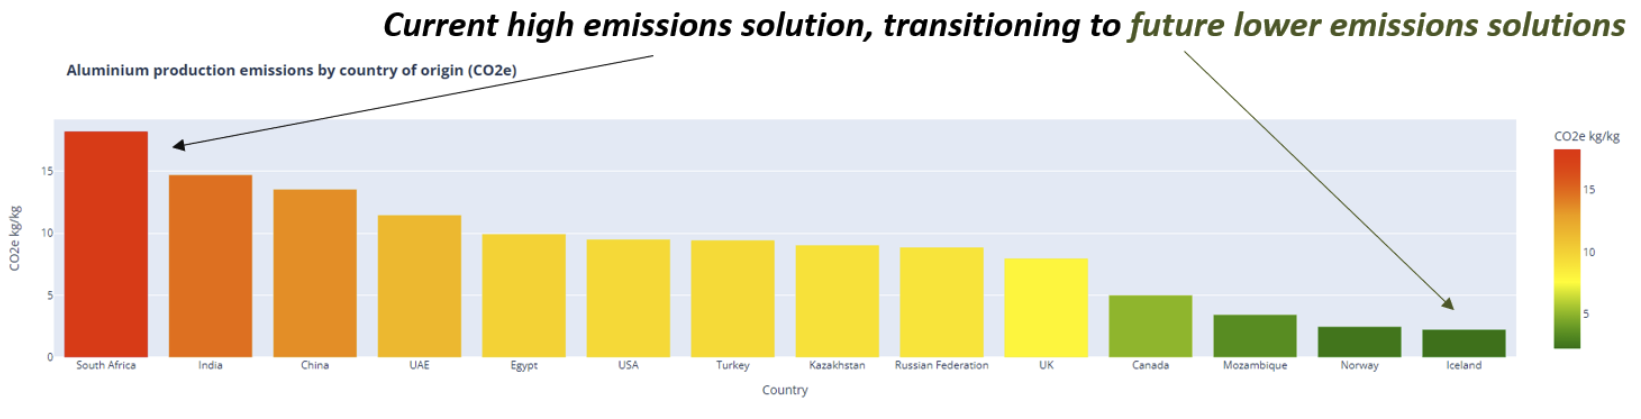
Transport and distribution choices
![]()
A maximum transition from HGV to rail of up to 60% of the volume of material to transport was applied
Business travel choices
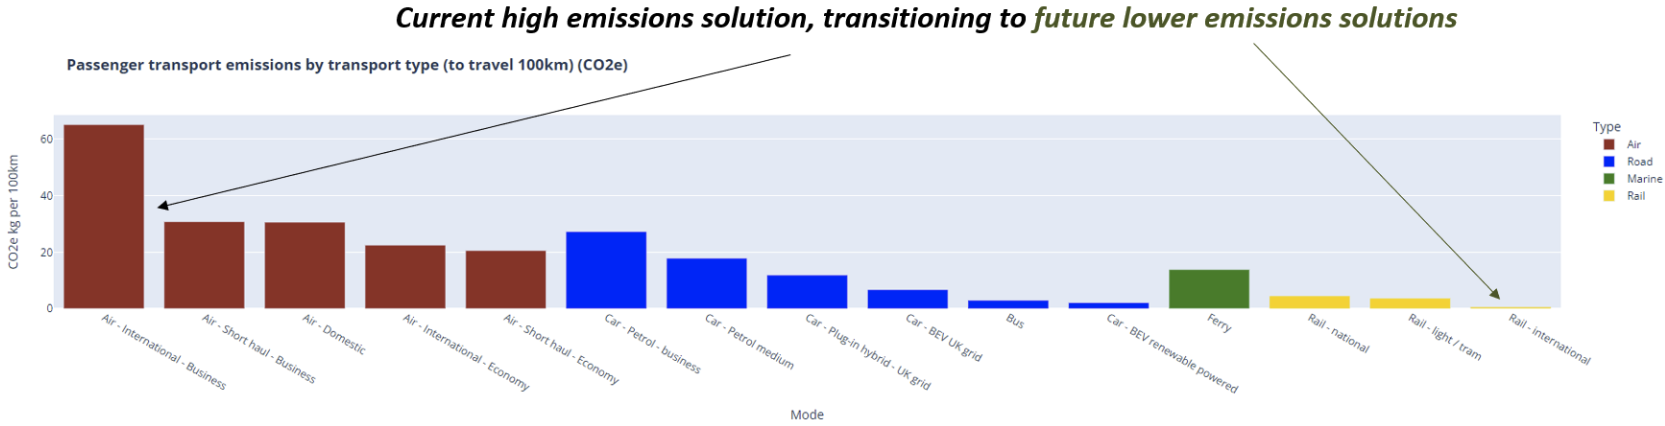
Also included as a choice on business travel was Air travel with purchased sustainable aviation fuel (SAF) to offset upto 50% of the emissions of any particular flight.
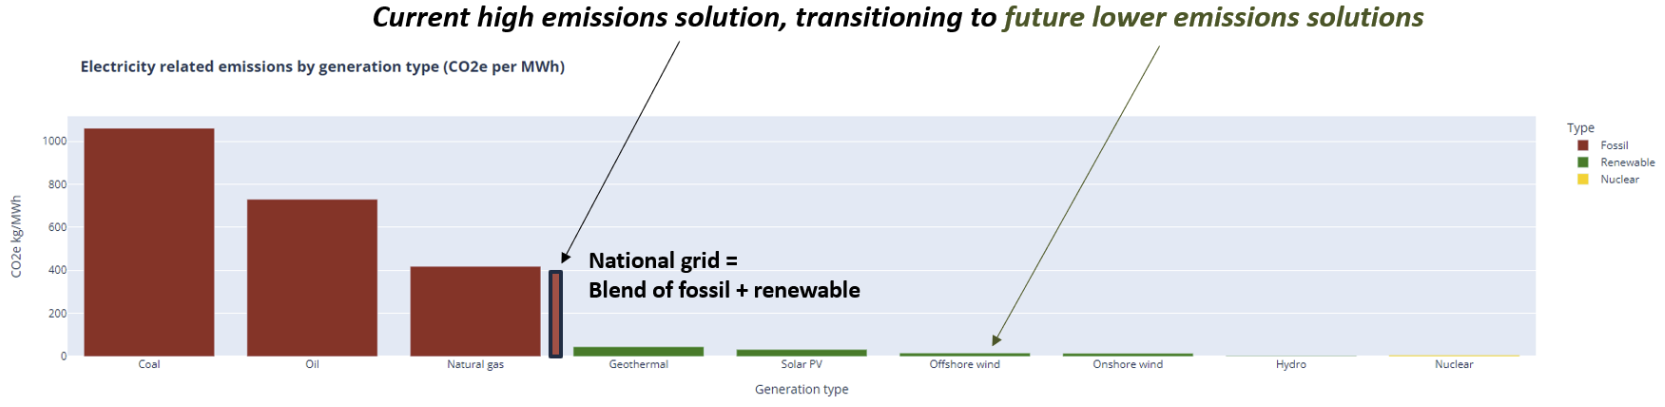
Electricity choices
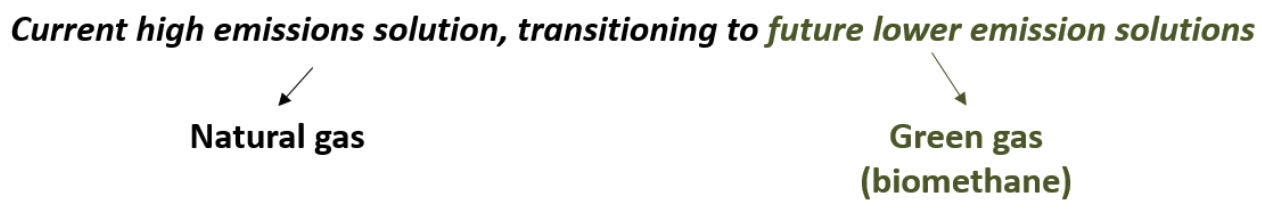
Heating choices
The above items were all fed into the decarbonization pathway solution
Step 4: Building the business flow, cost and input options
By defining the major items for your business (transport, steel, aluminium, electricity etc for this example), and the higher and lower emissions options (as we have just seen in the previous step) for those key inputs then the system automatically recognises the relationships and builds the process flow and demand needs for the business.
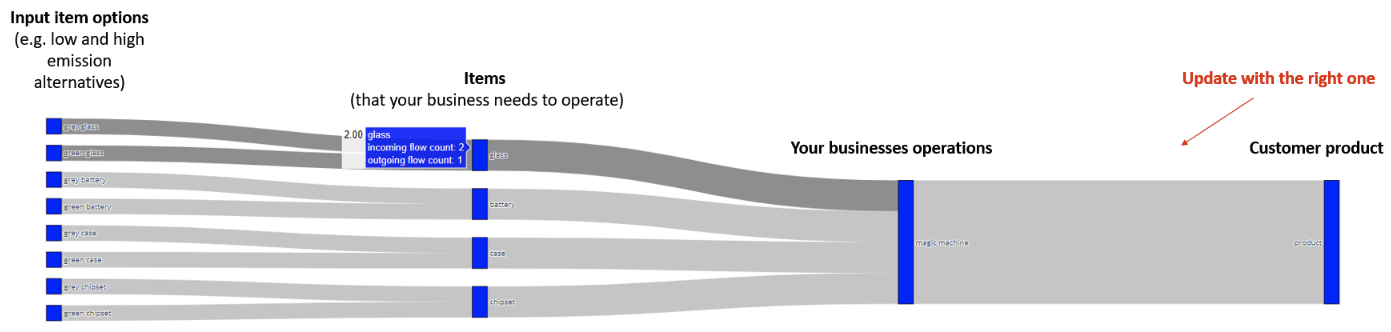
Generalised flow of high and low emission choices into the companies process
5. Estimate the initial decarbonization goals you want to achieve
Setting your decarbonization goals is often an iterative process because the size of the ambition or the inferred costs may allow the company to either become more or less ambitious depending on the outcome of the results of the analysis.
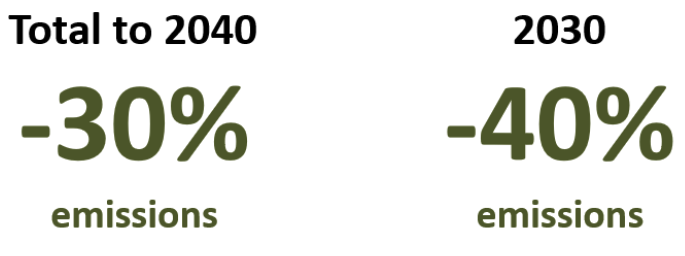
As an initial set of goals for this analysis the company is trying to achieve a reduction in emissions for its main product of:
- 40% from current day by 2030 (this aligns with IPCC goals and SBTi targets)
- 30% reduction in total emissions between now and 2040
6a. Automated optimized pathway
The system finds the optimum lowest cost solution given your inputs (the data from above). That data is entered as a simple table.
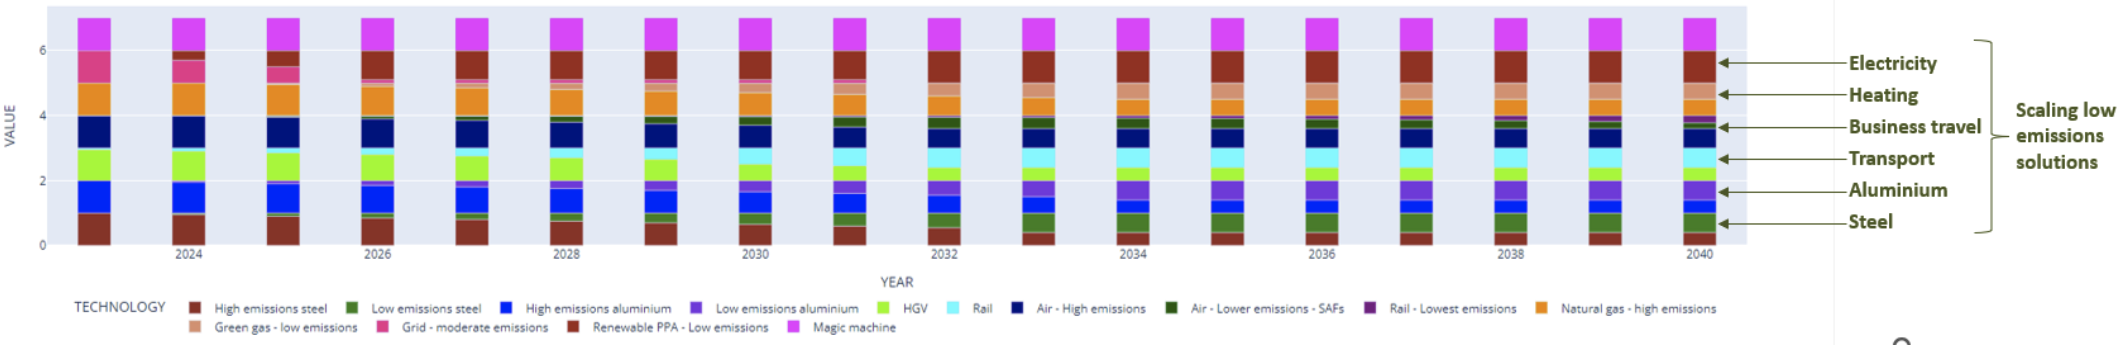
Solutions used in each year
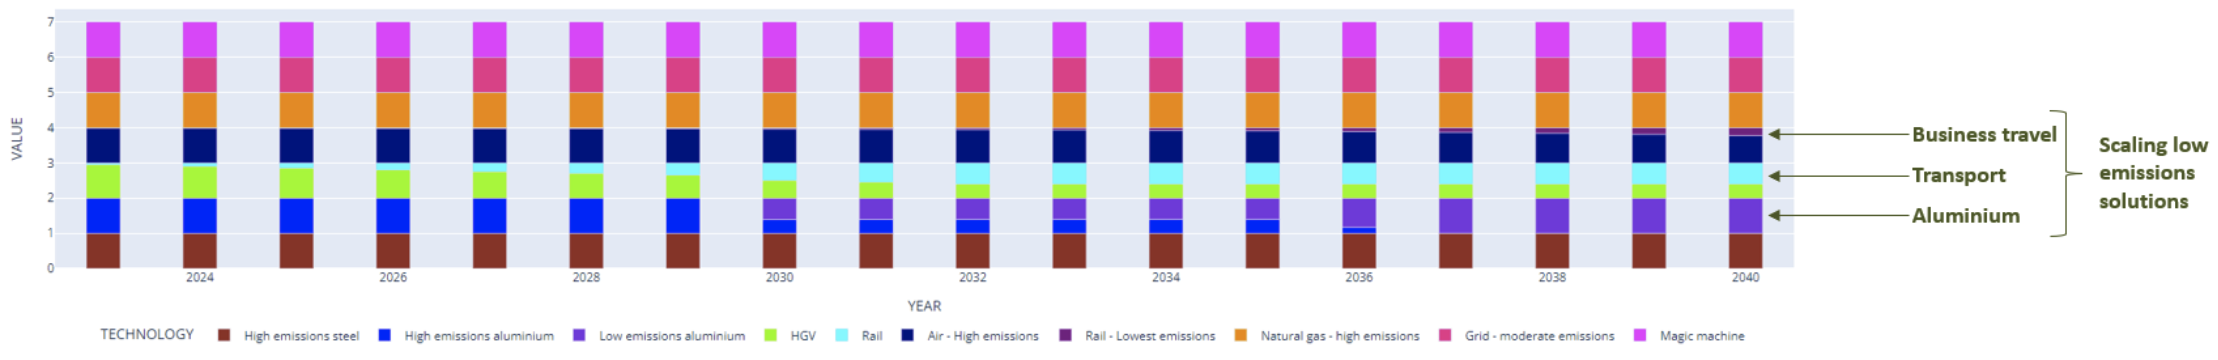
- The diagram shows the proportion of higher versus lower emissions solution required to deliver for the business with the lowest cost while achieving the emissions reduction goals
- On the left (current and near term years) the solutions are mostly the same as present
- Through the middle and late period there is a transition to lower emission solutions (for the cheapest and most emissions impactful items to transition to)
- Note: The optimised pathway is very selective, it ensures you meet you business goals while doing so at the lowest costs
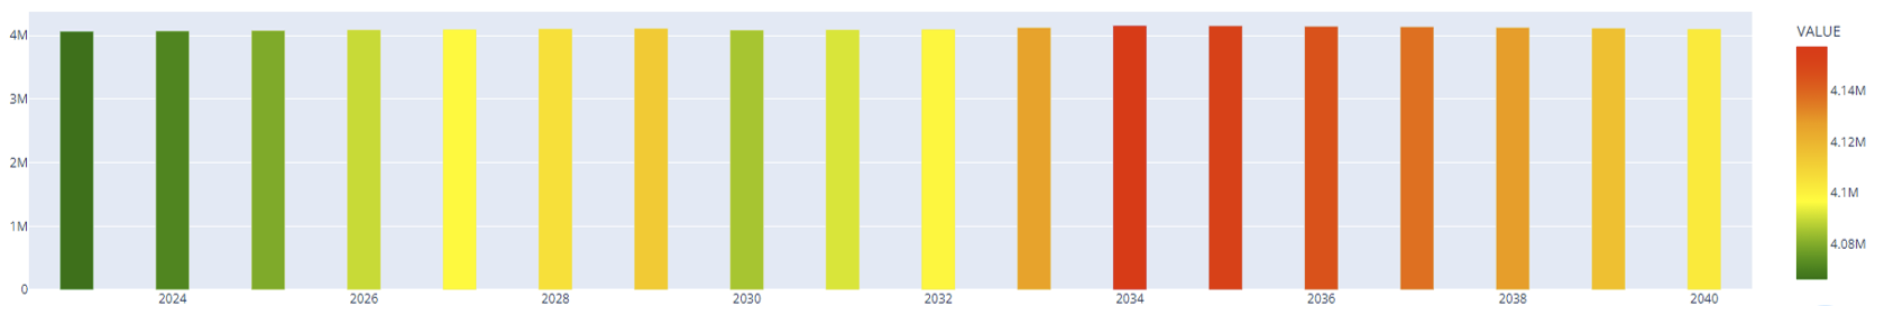
Total discounted cost / year
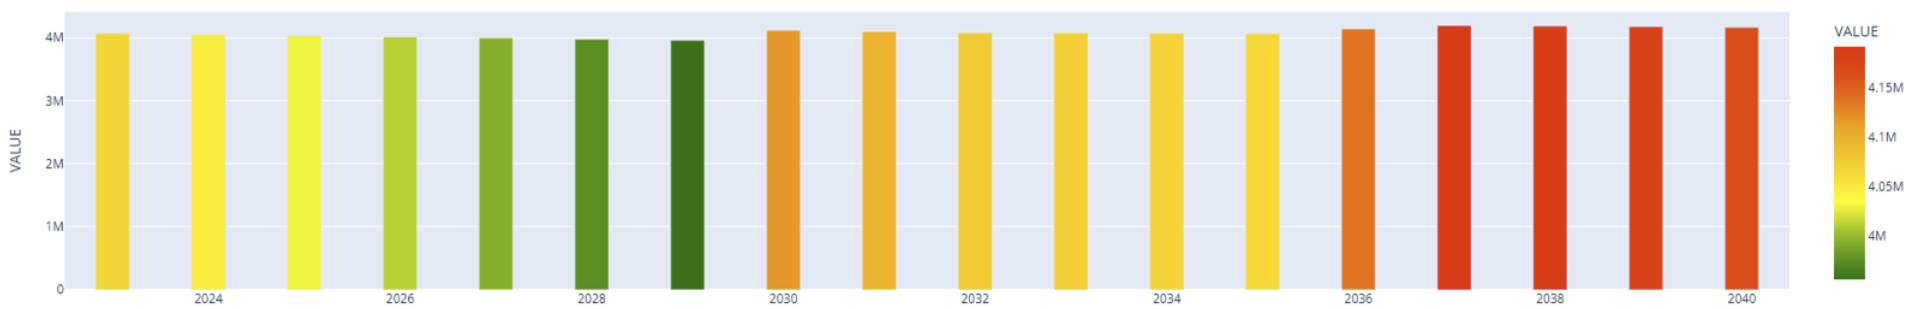
Annual discounted cost of running the activities required for the business (includes both original higher emissions and future lower emissions solutions)
Emissions pathway (optimised vs business-as-usual)
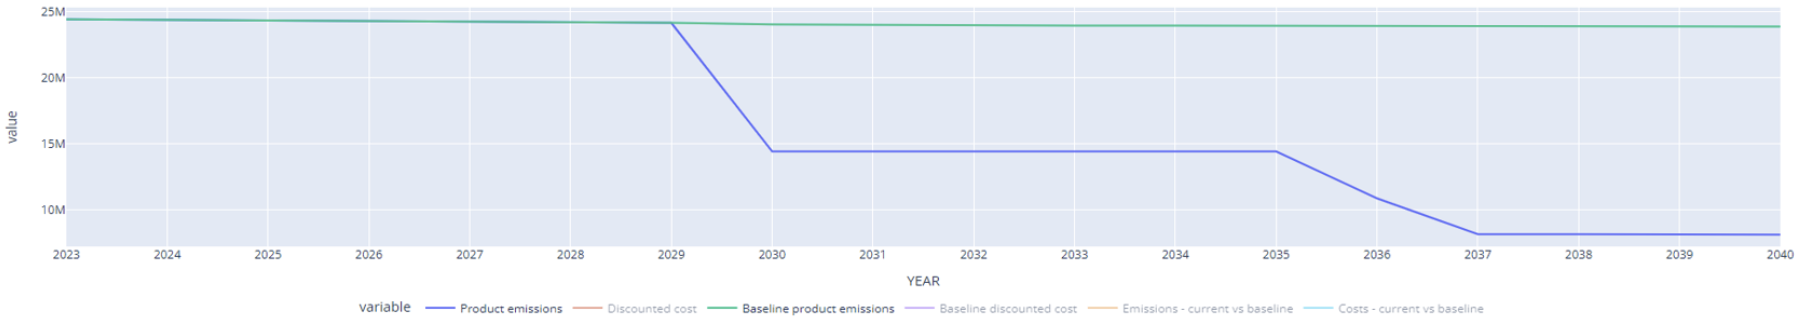
Emissions profile in the 'business-as-usual case' (upper line), and the emissions profile that is the least cost means of achieving the businesses goals
6b. Manual pathway
You can specify how rapid any particular items transition. This can be useful for stakeholder management and also reflect availability of new lower emission solutions.
Transition rate and availability of lower emissions technology
![]()
Solutions used in each year
Total discounted cost / year
Note: In this example case:
- The optimized decarbonization pathway was ~$700k cheaper than the manually defined transition across all areas
- The optimized decarbonization pathway was ~$650k cheaper than a less optimised pathway that was 20% adrift of the optimized pathway
7. Summary
- It's pretty quick and simple to make initial evaluations of potential decarbonization pathways using: generalised views of your business, publicly available emissions data and estimated costs
- This will highlight the most impactful areas where you can focus to drive a robust decarbonization strategy for your business
- Our solution allows you to quickly perform an automated, lowest cost, optimised, pathway prediction – this delivers the most economic solution
- You can also manually define transition rates and see what implications that has (or combine both approaches)
- As with all sustainability journeys the key is to start, its better to have a quick approximate pathway, rather than wait for the most accurate data possible. This has proven to be true across countless industries.
- You can refine that path as your data and understanding becomes enriched with time.
Get in touch
We are keen to work with organisations to allow them to build and implement robust and cost effective decarbonization strategies.
We would love to hear from you - info@example.com